Treasury Doubled Its Bond-Market Support. The Debt Stayed.
Older government bonds are getting harder to move as household demand and construction soften. Larger buybacks can reduce that friction. They cannot supply durable central-bank money or cheap credit.

- Coverage
- Growth / Treasury market / Interest rates / Global pressure
- Evidence cutoff
- August 19 · 13:05 UTC
Chapters
The bond market got maintenance while borrowers kept the pressure.
Treasury will at least double the maximum size of operations that buy older ten-to-thirty-year government bonds. The change matters because those bonds become harder to trade as newer issues replace them. It does not turn Treasury into the Federal Reserve.
- Treasury increased the repair budget. Starting September 9, each long-end liquidity-support buyback can purchase at least $4 billion, up from $2 billion.
- The plumbing problem is real. In New York Fed data, the newest two-year note traded $56.3 billion a day on average. The second-newest traded $5.5 billion.
- The funding boundary stayed intact. Settlement can briefly move cash from Treasury's account into bank reserves. Debt issuance replenishes that account; Treasury cannot make a lasting reserve addition on its own.
- The economy still pays the long rate. July retail sales fell 0.6%, housing starts fell 12.4%, and the thirty-year Treasury yield remained 5.28%. Better trading does not make a mortgage cheap.
Long-end buybacks will be at least twice as large.
Treasury announced on August 19 that it will increase liquidity-support buybacks in the ten-to-twenty-year and twenty-to-thirty-year sectors. The maximum for each operation rises from $2 billion to at least $4 billion from September 9 through November 4.
Treasury wants old bonds to be easier to sell. It issues new benchmark bonds on a regular schedule. Yesterday's benchmark remains outstanding, but trading migrates to the new one. Dealers become the bridge between investors who want to sell an old issue and investors willing to buy it.
Treasury said the larger operations follow “consistent strong sponsorship” and high-quality offers in recent buybacks. The description points to a tool that attracted sellers rather than an emergency in which dealers stopped functioning.
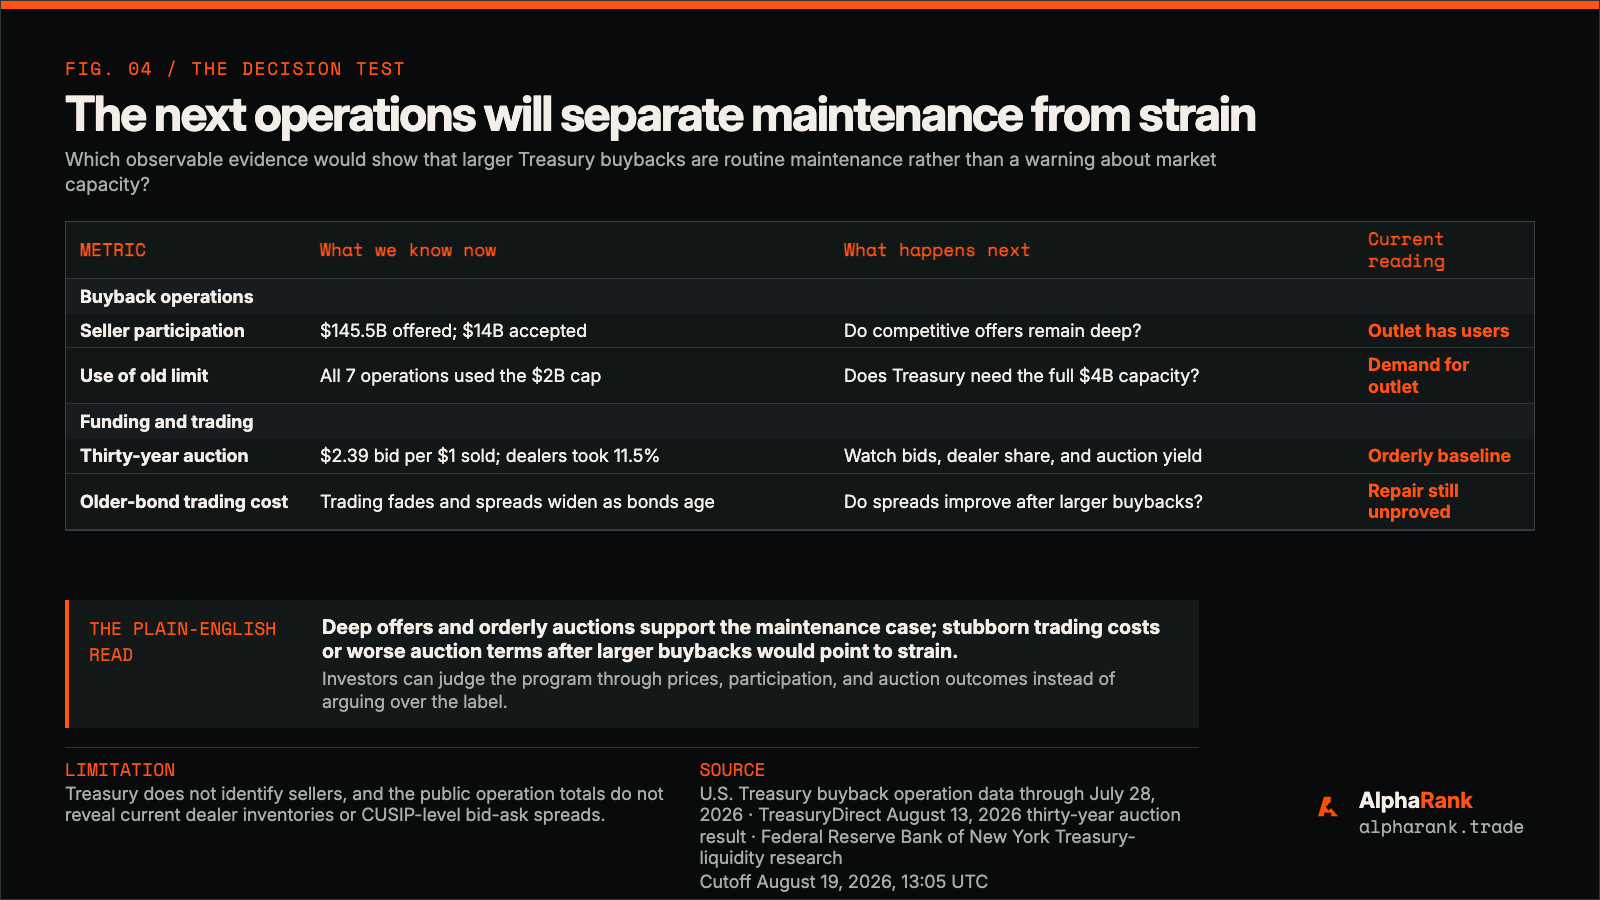
Treasury's operation data give the new maximum practical weight. All seven long-end operations from June 3 through July 28 used their full $2 billion caps. Sellers offered $145.5 billion of bonds for $14 billion of accepted purchases. Large offers show that the outlet had users; they do not reveal whether those sellers were constrained.
The $4 billion figure is a maximum for selected bonds and competitive offers. Yields, auction demand, and the market's total debt absorption remain market-priced.
The market is deepest where the debt is newest.
New York Fed researchers found that less than 4% of Treasuries outstanding—the newest issues—account for 65% of average daily trading. Older bonds make up almost all the stock of debt but trade less often and at wider spreads.
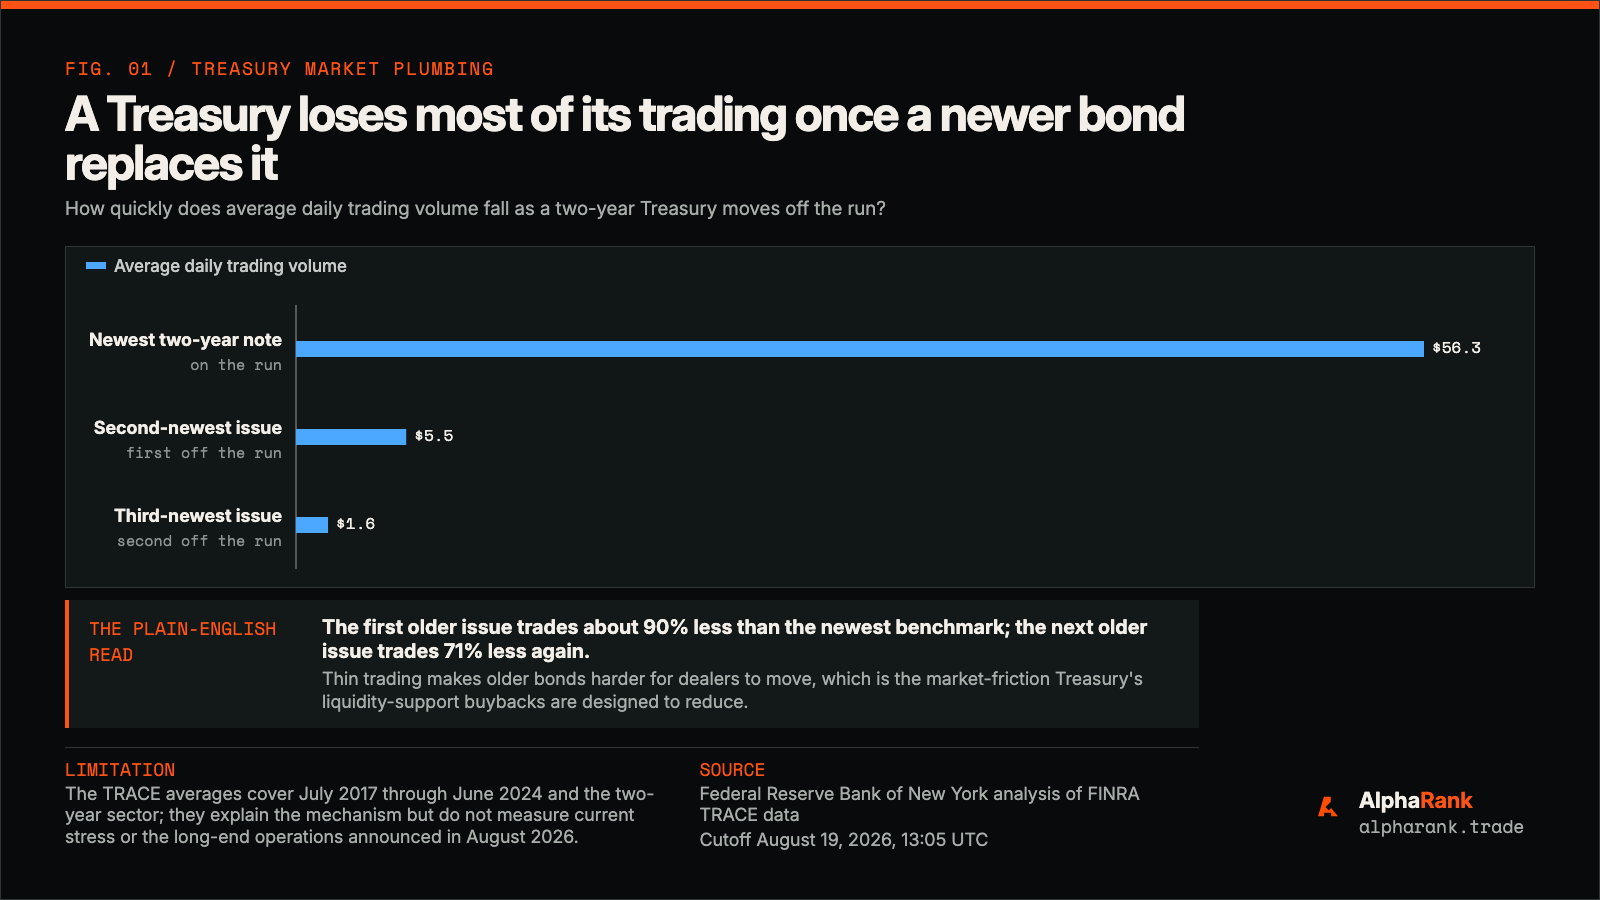
The first older two-year issue in the study traded about 90% less than the newest note. The next older issue traded 71% less again. The same pattern appeared in longer maturities. Because buyers and sellers are less likely to arrive together, a dealer often has to hold the old bond until another customer appears.
A buyback gives that dealer another exit. Treasury takes an old bond out of circulation. The dealer gets cash and room on its balance sheet to intermediate another trade. That can narrow the penalty for owning yesterday's benchmark and make the world's base collateral easier to move.
Treasury changes the bond. The Fed changes the money.
A Treasury buyback and a Federal Reserve asset purchase both involve government bonds. The funding path makes them economically different.
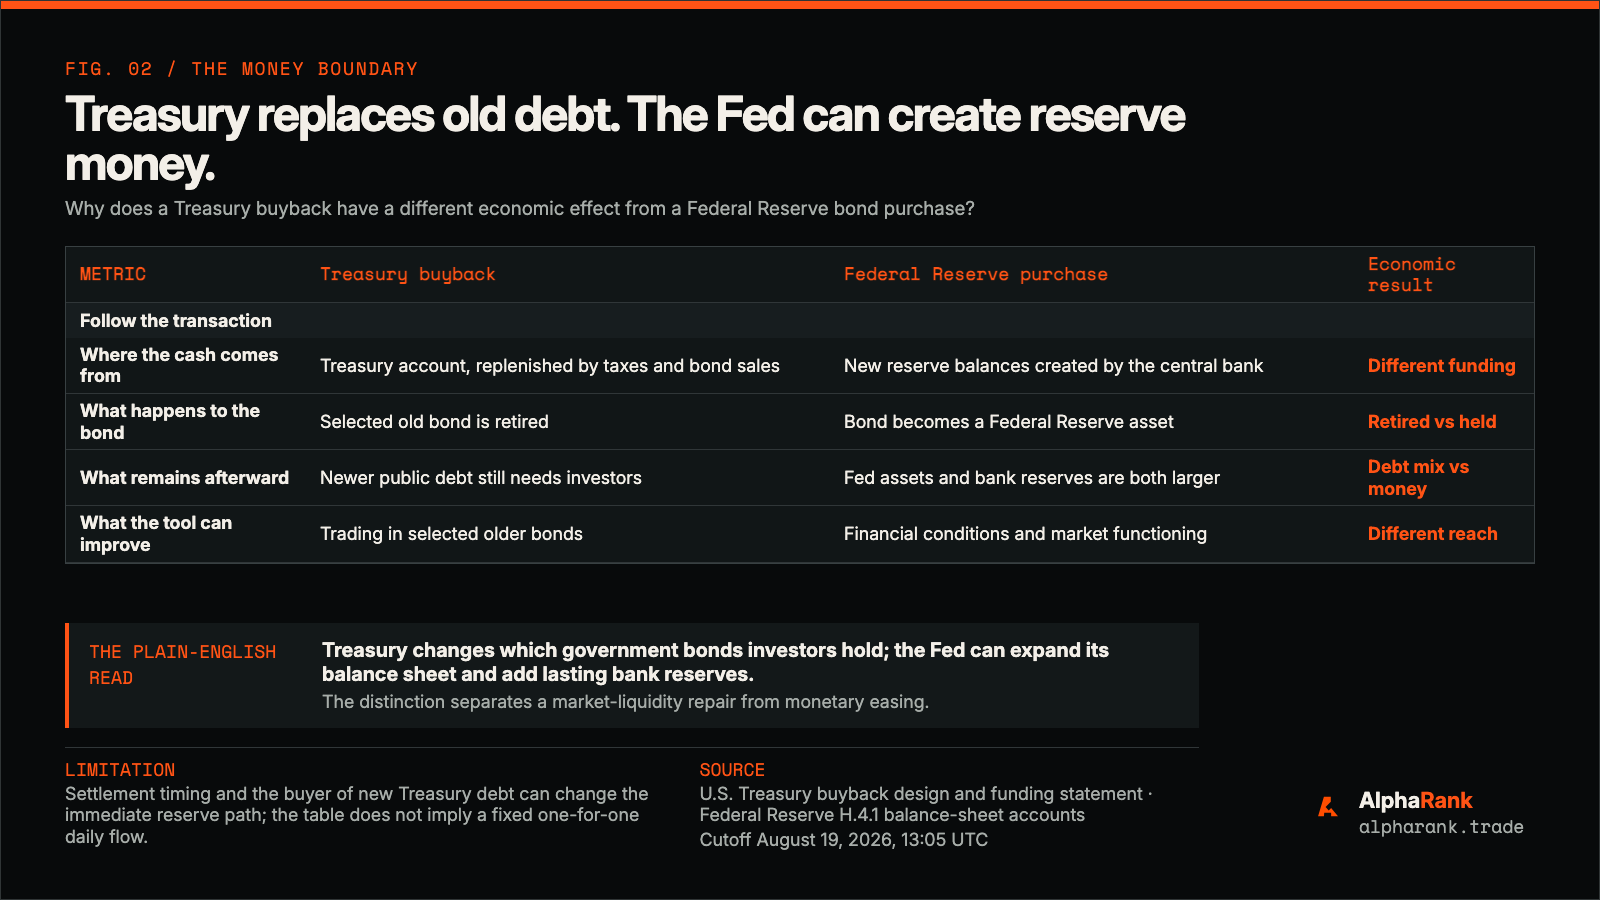
Treasury sells or plans new, liquid securities and uses cash financed through its ordinary budget process to retire selected old, illiquid ones. The mix improves. The debt stays. The Fed's balance-sheet tables show Treasury's account and bank reserves as separate liabilities: settlement can move balances between them, but Treasury cannot expand the Fed's assets or supply permanent reserves by itself.
The tool can relieve dealer balance-sheet pressure and the cost of trading older bonds. Treasury has not shown that dealers are currently constrained. Mortgage rates, deficits, and demand at the next auction remain separate constraints.
Spending and building weakened while long yields stayed high.
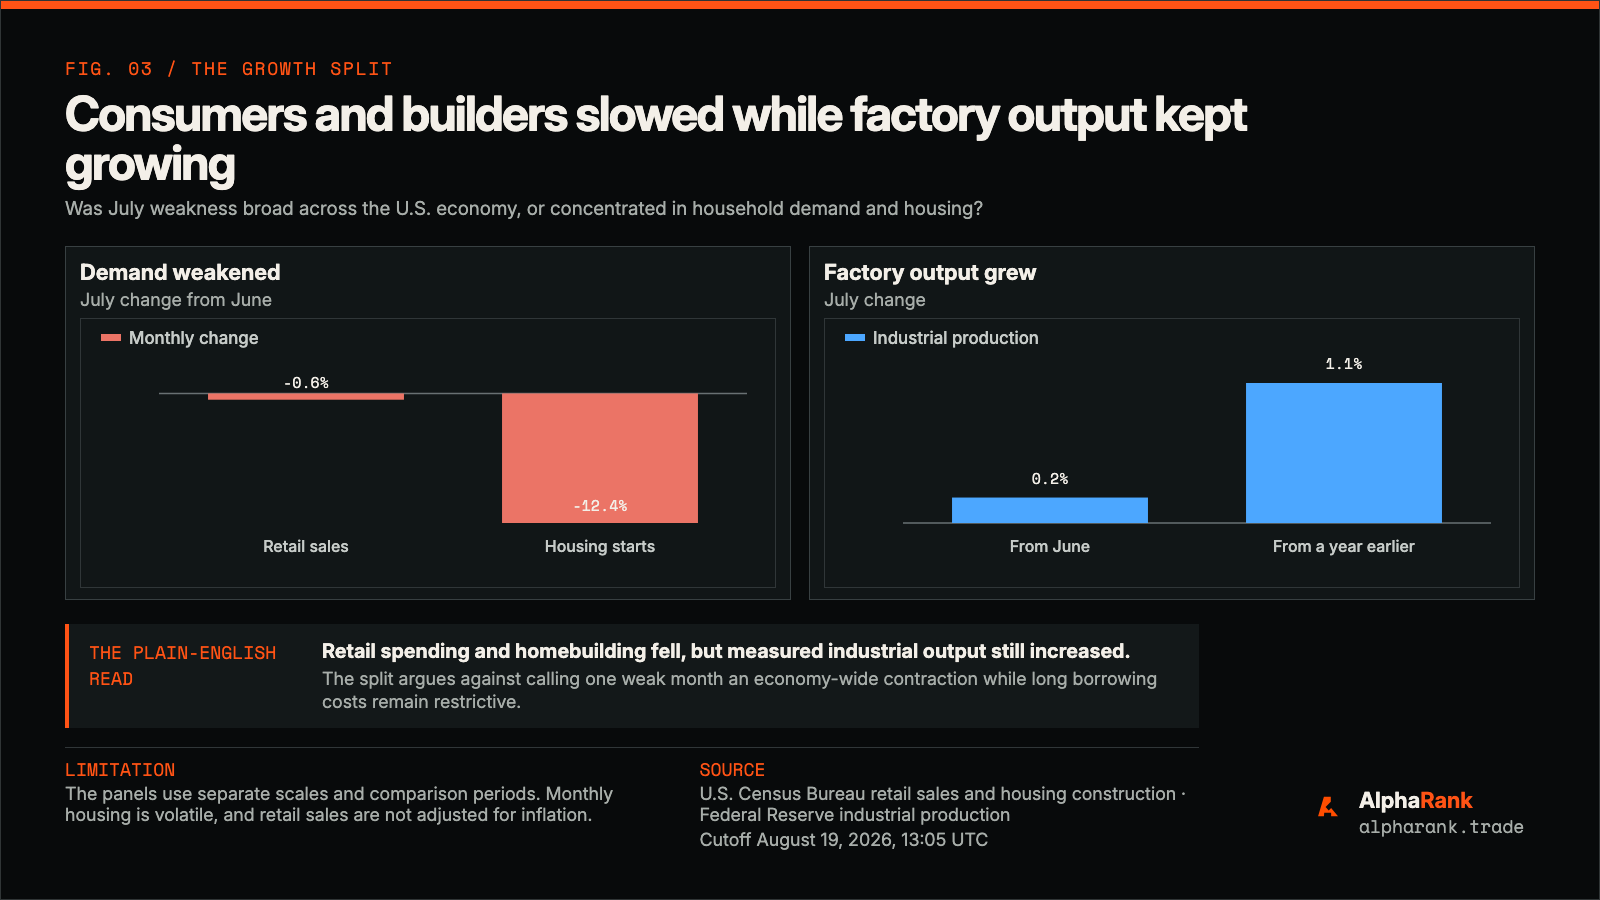
The latest data describe an economy losing momentum without receiving broad credit relief. July retail sales fell 0.6% from June, the first decline in nine months. The series is not adjusted for inflation, so it measures dollars spent rather than the quantity of goods bought.
The tax-refund boost faded.
Retail sales still stood 5.0% above a year earlier, and the May-through-July period was 6.3% higher. One down month warns about momentum but cannot establish a collapse in consumption.
New construction dropped sharply.
Housing starts fell 12.4% in July and 13.5% from a year earlier. Permits rose 5.0%, leaving a possible pipeline if financing and demand improve.
Upstream inflation stopped rising for a month.
Producer prices were unchanged in July: services rose 0.2% and goods fell 0.7%. The index remained 4.7% above a year earlier.
The split was channel-specific. Industrial production grew 0.2% in July, and the ISM manufacturing survey rose to 55.6. Production remained resilient while household purchases and residential construction lost momentum.
The rates that reach borrowers remained restrictive. On August 18, the two-year Treasury yield was 4.19%, the ten-year 4.71%, and the thirty-year 5.28%, according to Treasury's official curve. Since August 12, the two-year slipped one basis point while the ten-year rose three and the thirty-year rose four. Markets priced a little less short-rate pressure without granting long borrowers relief.
Better plumbing still has to carry more debt.
Treasury's August refunding plan kept coupon-auction sizes steady for several quarters, but it also projected a $950 billion cash balance at the end of September and a possible peak near $1.05 trillion in late October.
That cash rebuild requires borrowing before the government spends the money back into the economy. Treasury also planned up to $38 billion of off-the-run liquidity-support buybacks this quarter and up to $25 billion of short-maturity cash-management buybacks. The operations can improve which securities the market holds. They do not remove the need to finance deficits and a large cash account.
This is why the long end can resist good inflation news. A buyer of a thirty-year bond must price decades of inflation risk, future deficits, and the possibility that still more bonds arrive. Easier trading lowers one friction. It does not settle the price that clears the whole supply.
China weakened while the Fed's internal split moved into view.
China's official manufacturing index fell to 49.2 in July from 50.3 in June. A reading below 50 means surveyed factories reported contraction rather than expansion. New orders fell to 48.5, the weakest reading since 2023.
Weak Chinese demand can lower commodity pressure, but it also removes a source of world growth. For U.S. companies, that mix can mean cheaper inputs and softer foreign sales at the same time.
The Federal Reserve held its policy rate at 3.50% to 3.75% in July, but three of twelve voters wanted an increase. Minutes from that meeting arrive after this report's cutoff. They will show whether the dissent was mainly about energy-driven inflation, underlying demand, or the risk that waiting allows price pressure to spread.
The minutes were not available at 13:05 UTC. They are a next test, not evidence retrofitted into this edition.
The disagreement is about signal, not mechanics.
AlphaRank's private research review found a sharp split. One side treated larger buybacks as evidence that fiscal authorities will keep intervening, with possible consequences for inflation and the dollar. The other insisted that calling the program “stealth QE” confuses a debt-management swap with money creation.
A larger outlet can prevent old bonds from clogging dealer books.
The New York Fed's transaction data show why the tool exists. Treasury also reported strong participation and high-quality offers, which argues that the market is using the facility as designed.
The need for support is itself a warning.
A market with more than $30 trillion outstanding is asking dealers to absorb repeated issuance. Even routine maintenance can reveal that intermediation capacity has become a policy constraint.
Treasury-market capacity now matters enough to expand the maintenance tool. The signal turns bearish if larger buybacks fail to improve trading or new auctions require meaningfully higher yields.
This may be successful maintenance, not a stress response.
Treasury began designing regular buybacks before this week's weak retail and housing releases. In July 2025, the Treasury Borrowing Advisory Committee said the program had capacity to double and identified these same two long-end sectors as candidates for larger operations. The longer planning record supports routine expansion more strongly than emergency rescue.
There is also a scale check. A $4 billion maximum operation is small beside a market with more than $30 trillion outstanding. The program selects specific older bonds rather than promising to absorb the long end at any price. Five days before the announcement, the thirty-year auction drew $2.39 of bids per dollar sold, and dealers received 11.5% of competitive awards. The result supplies an orderly pre-announcement auction baseline.
Watch the operation, the auction, the consumer, and the Fed.
Does Treasury need the full new capacity?
Compare the amount offered, accepted, and paid with the higher maximum. A cap is not the same as a purchase commitment.
Can new long debt clear without a larger concession?
Watch bid-to-cover ratios, dealer awards, and the gap between the auction yield and the market yield just before bidding closes.
Does weak retail spending spread into income?
The next PCE report combines household income, spending, and the Fed's preferred inflation measure. Growth needs income to hold while prices cool.
Why did three officials want tighter policy?
Minutes released after this cutoff will reveal whether inflation concern can survive softer demand and construction.
The government doubled a tool for moving old bonds through a market that is carrying more debt. If trading improves and auctions remain orderly, the repair worked. If long yields keep rising while household demand weakens, better plumbing will only make a restrictive system run more smoothly.
Sources and methodologyPrimary releases, central-bank records, market data, and AlphaRank analysis that protects internal source identities
Every material public claim is supported by public evidence. AlphaRank's internal research process was used to find leads, contradictions, and omissions, never as a substitute for the sources below.
- Treasury long-end buyback increaseTREASURY.GOV
- Treasury August refunding statementTREASURY.GOV
- TBAC review of buyback capacityTREASURY.GOV
- Treasury buyback design and fundingTREASURY.GOV
- Treasury buyback operation dataFISCALDATA.TREASURY.GOV
- Treasury August 13 auction resultTREASURYDIRECT.GOV
- New York Fed Treasury-liquidity studyNEWYORKFED.ORG
- Off-the-run Treasury market staff reportNEWYORKFED.ORG
- Treasury nominal yield curveTREASURY.GOV
- Census July retail salesCENSUS.GOV
- AP retail-sales contextAPNEWS.COM
- Census July housing constructionCENSUS.GOV
- BLS July producer pricesBLS.GOV
- Federal Reserve July industrial productionFEDERALRESERVE.GOV
- ISM July manufacturing surveyISMWORLD.ORG
- BLS July consumer pricesBLS.GOV
- BLS July employment reportBLS.GOV
- Federal Reserve July decisionFEDERALRESERVE.GOV
- Federal Reserve minutes calendarFEDERALRESERVE.GOV
- Federal Reserve balance-sheet accountsFEDERALRESERVE.GOV
- China July manufacturing surveySTATS.GOV.CN
Window. Primary window August 12-19, 2026; older evidence appears only when it explains the buyback mechanism.
Evidence cutoff. August 19, 2026 at 13:05 UTC. The Federal Reserve minutes scheduled later that day were not available.
Source records. Exact private source records stay in the internal evidence ledger. Public output uses publishable sources or source-blind AlphaRank analysis.
Evidence labels. Direct observations, public-body assessments, and AlphaRank interpretations remain separate in the research packet.
AlphaRank TLDR is independent analysis for informational purposes only. It is not investment, legal, tax, or accounting advice.