Crypto AI: Who Is Actually Making Money?
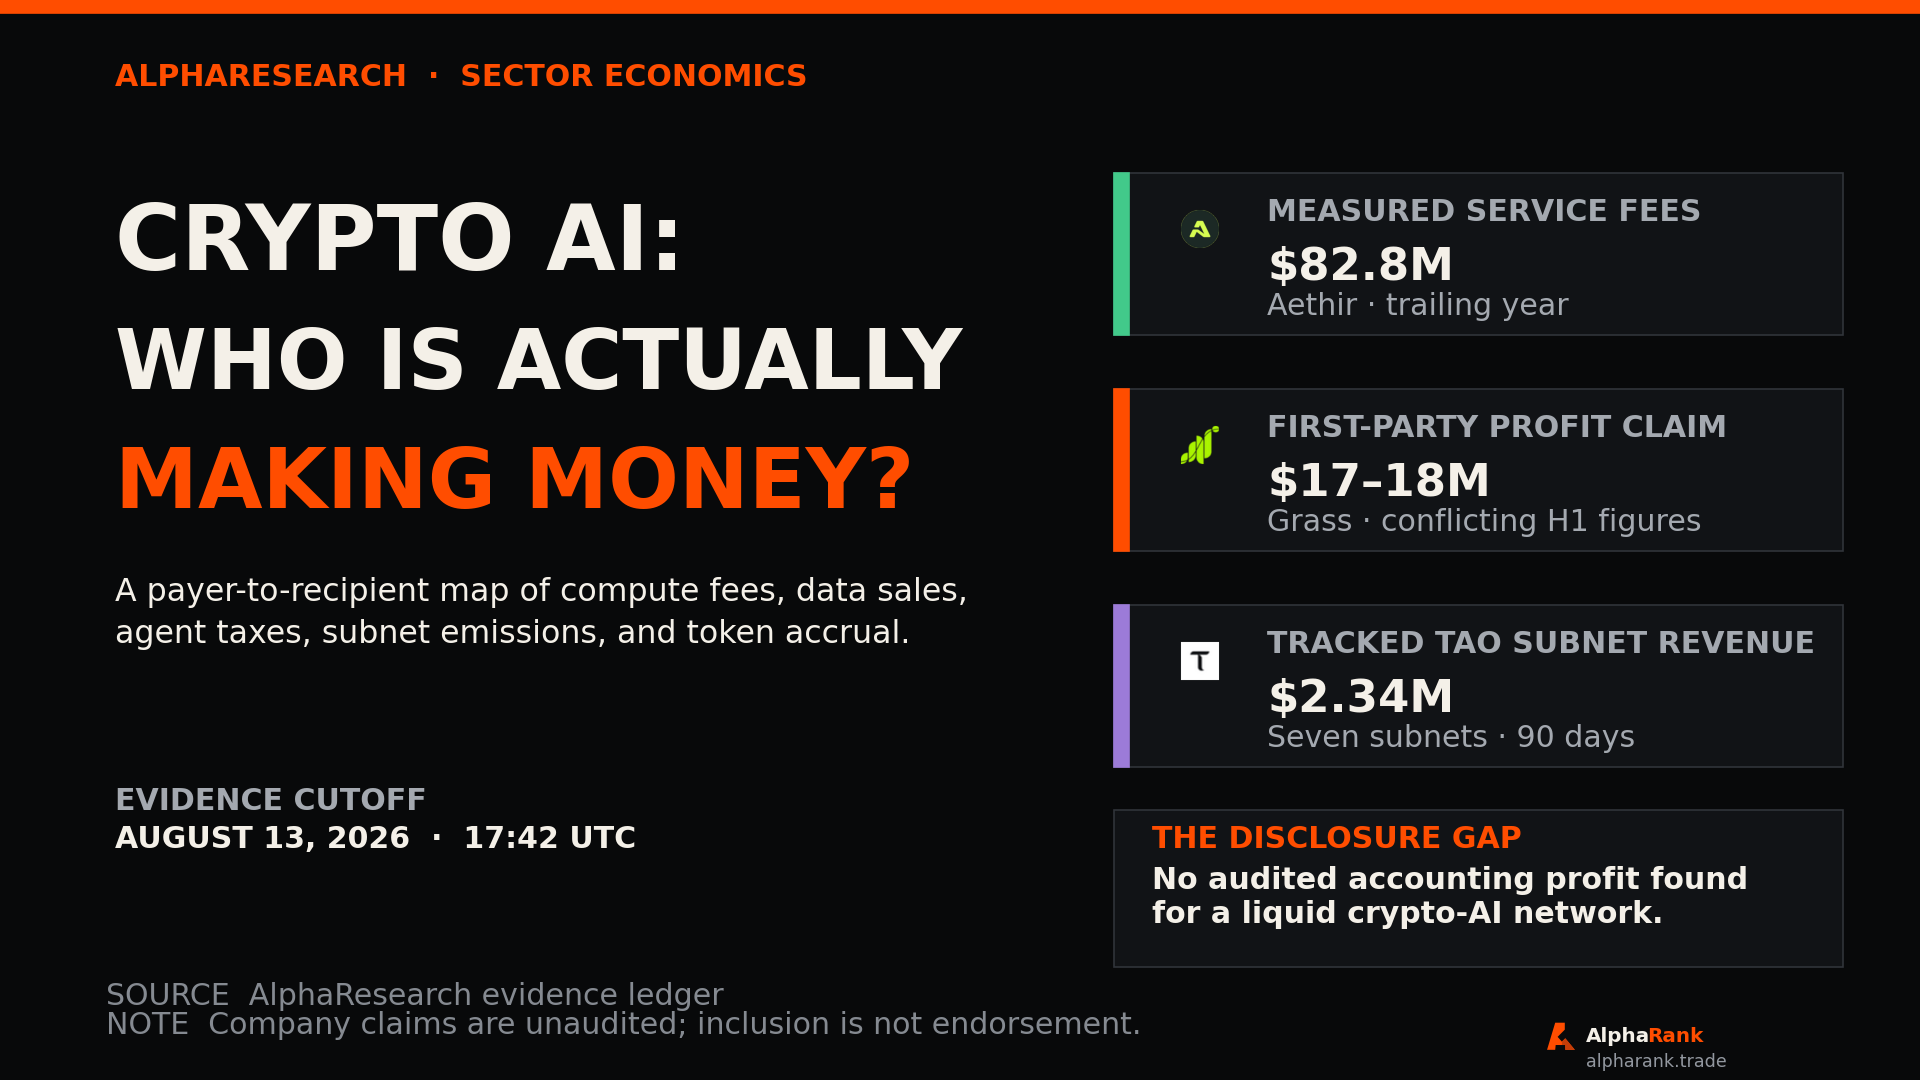
A payer-to-recipient audit of decentralized compute, data, agents, token mechanisms, and TAO subnets. The answer changes depending on whether “making money” means company revenue, customer fees, supplier payouts, token capture, or accounting profit.

- Coverage
- Crypto AI / DeAI / TAO
- Evidence cutoff
- August 13 · 17:42 UTC
Chapters
Four projects lead four different financial tests.
- Aethir leads the measured service-fee set.Tenants paid $82.77M over the trailing year. A documented 80/20 rule implies $66.21M for cloud hosts and $16.55M for the protocol. Protocol share is not profit.
- Prime Intellect leads the first-party company run rates.The company reported more than $100M of annualized revenue across a blended compute, training, inference, and evaluation stack. It is not an audited annual result.
- Grass has the strongest profit claim and an unresolved top line.The same official page says both $17M and $18M for H1 2026, gives monthly cash expenses of $2M to $3M, and calls the business profitable. No audited statements were supplied.
- Virtuals has real fees, but not a clean AI-service line.The $20.10M trailing-year series includes agent-token trading taxes and product-specific allocations. Traders may be the payer even when agents are the story.
- Compute has the best outside-payer evidence.Render, Akash, Livepeer, Aethir, and Chutes show paid work. The supplier, protocol, emission, and token routes are different in every case.
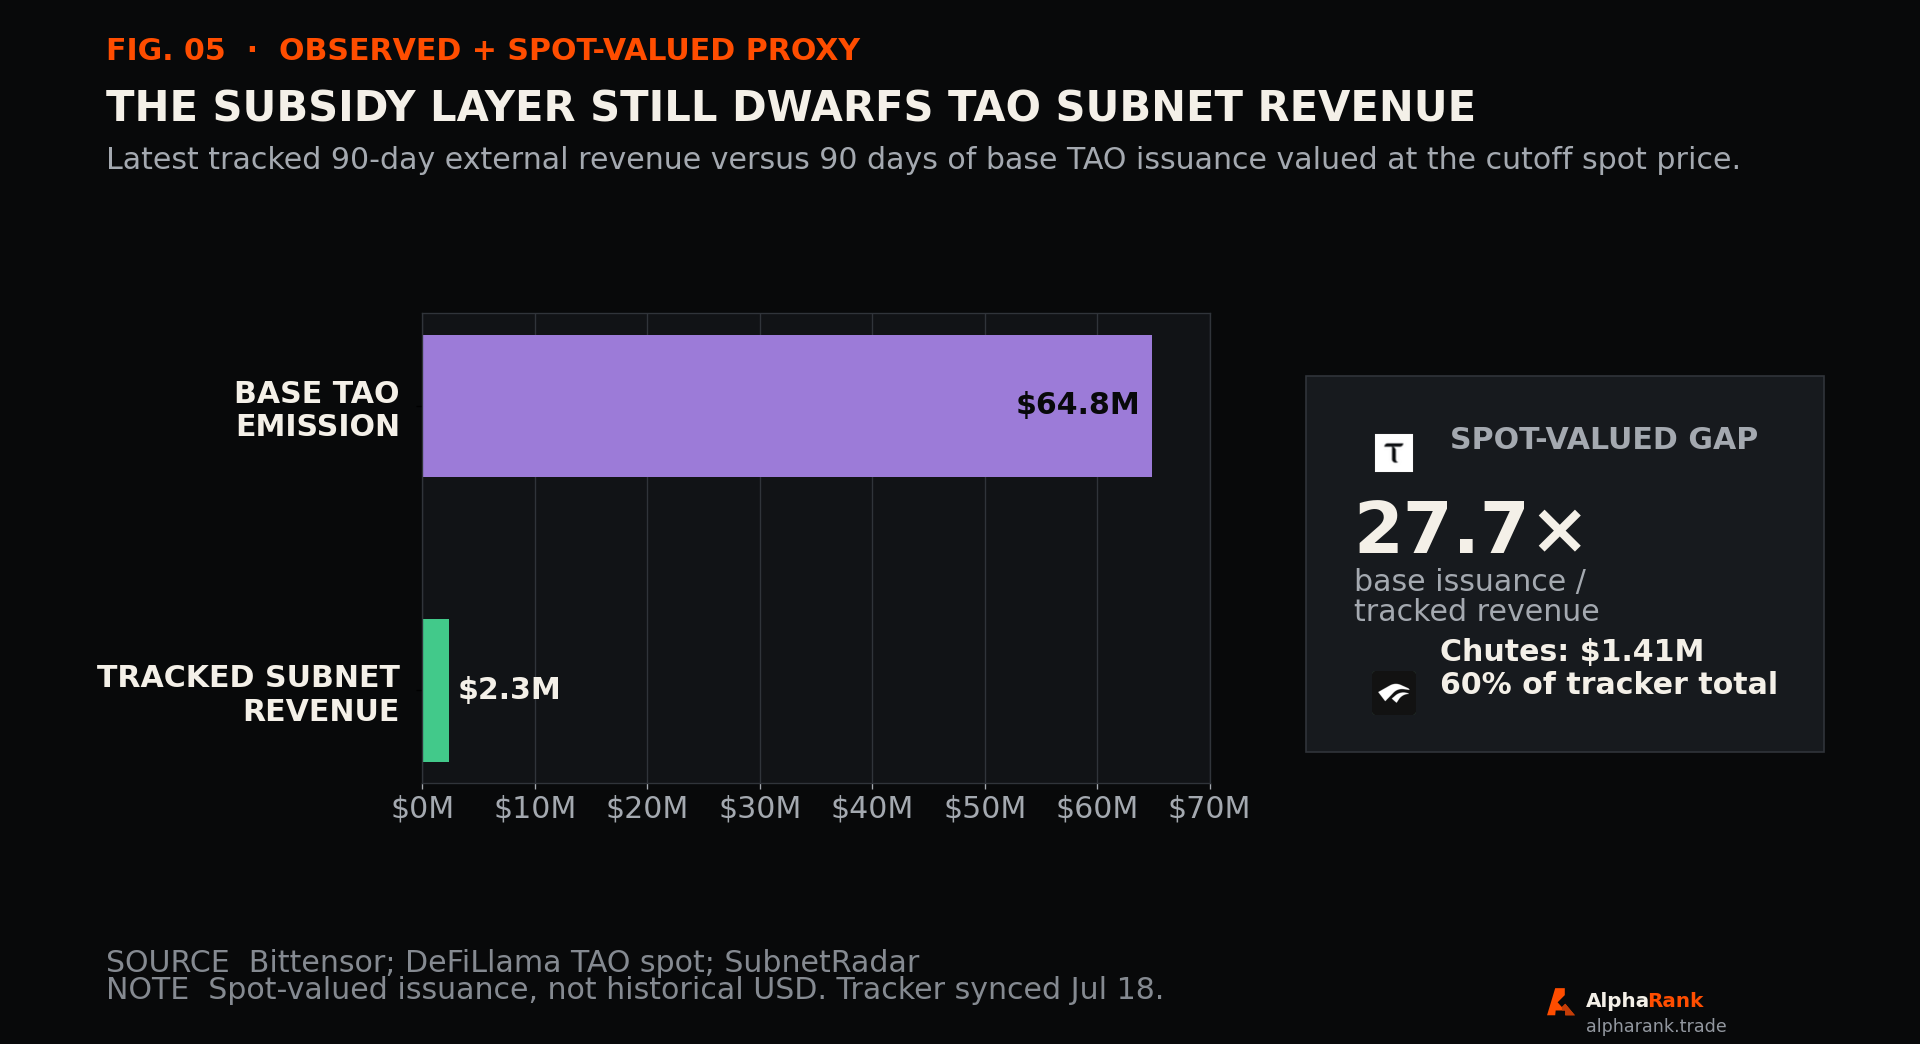
- TAO subnets have customers, but emissions still dominate the visible economy.Seven tracker entries totaled $2.34M in the latest 90-day snapshot. The same-length base issuance proxy was 27.7 times larger.
- Audited accounting profit is the missing disclosure.No liquid crypto-AI network in the selected set supplied an audited statement that reconciled revenue, suppliers, incentives, operating expenses, and net income.
Follow the payer, the recipient, and the cost base.
In crypto AI, a large “revenue” number can mean customer cash, a supplier pass-through, token issuance, capital yield, a burn, or a dashboard estimate. Those are not interchangeable.
A useful financial claim answers six questions. Who paid? What did the payer receive? How much entered the system? Who received it? Which incentives subsidized the activity? What remained after direct and operating costs?
A customer pays for compute, data, inference, an agent job, or another service.
Hosts, miners, validators, or model operators receive their share.
The protocol or company retains a disclosed amount after pass-through.
New tokens are recorded separately from customer-funded payouts.
Burns, buybacks, distributions, or required demand reach the asset.
Full costs are subtracted before anyone calls the result profit.
A token reward proves that a network can pay a supplier. It does not prove that a customer paid the network.
The ecosystem has far more products than proven payers.
Crypto AI includes compute markets, data businesses, agent platforms, subnet economies, and privacy systems. A project map becomes useful only when it also shows the quality of its financial evidence.
The map groups 21 selected projects by what they sell. Each subgroup names the strongest financial evidence found: measured customer or platform money, first-party company disclosure, or economics that remain unresolved. The status describes evidence quality, not product quality.
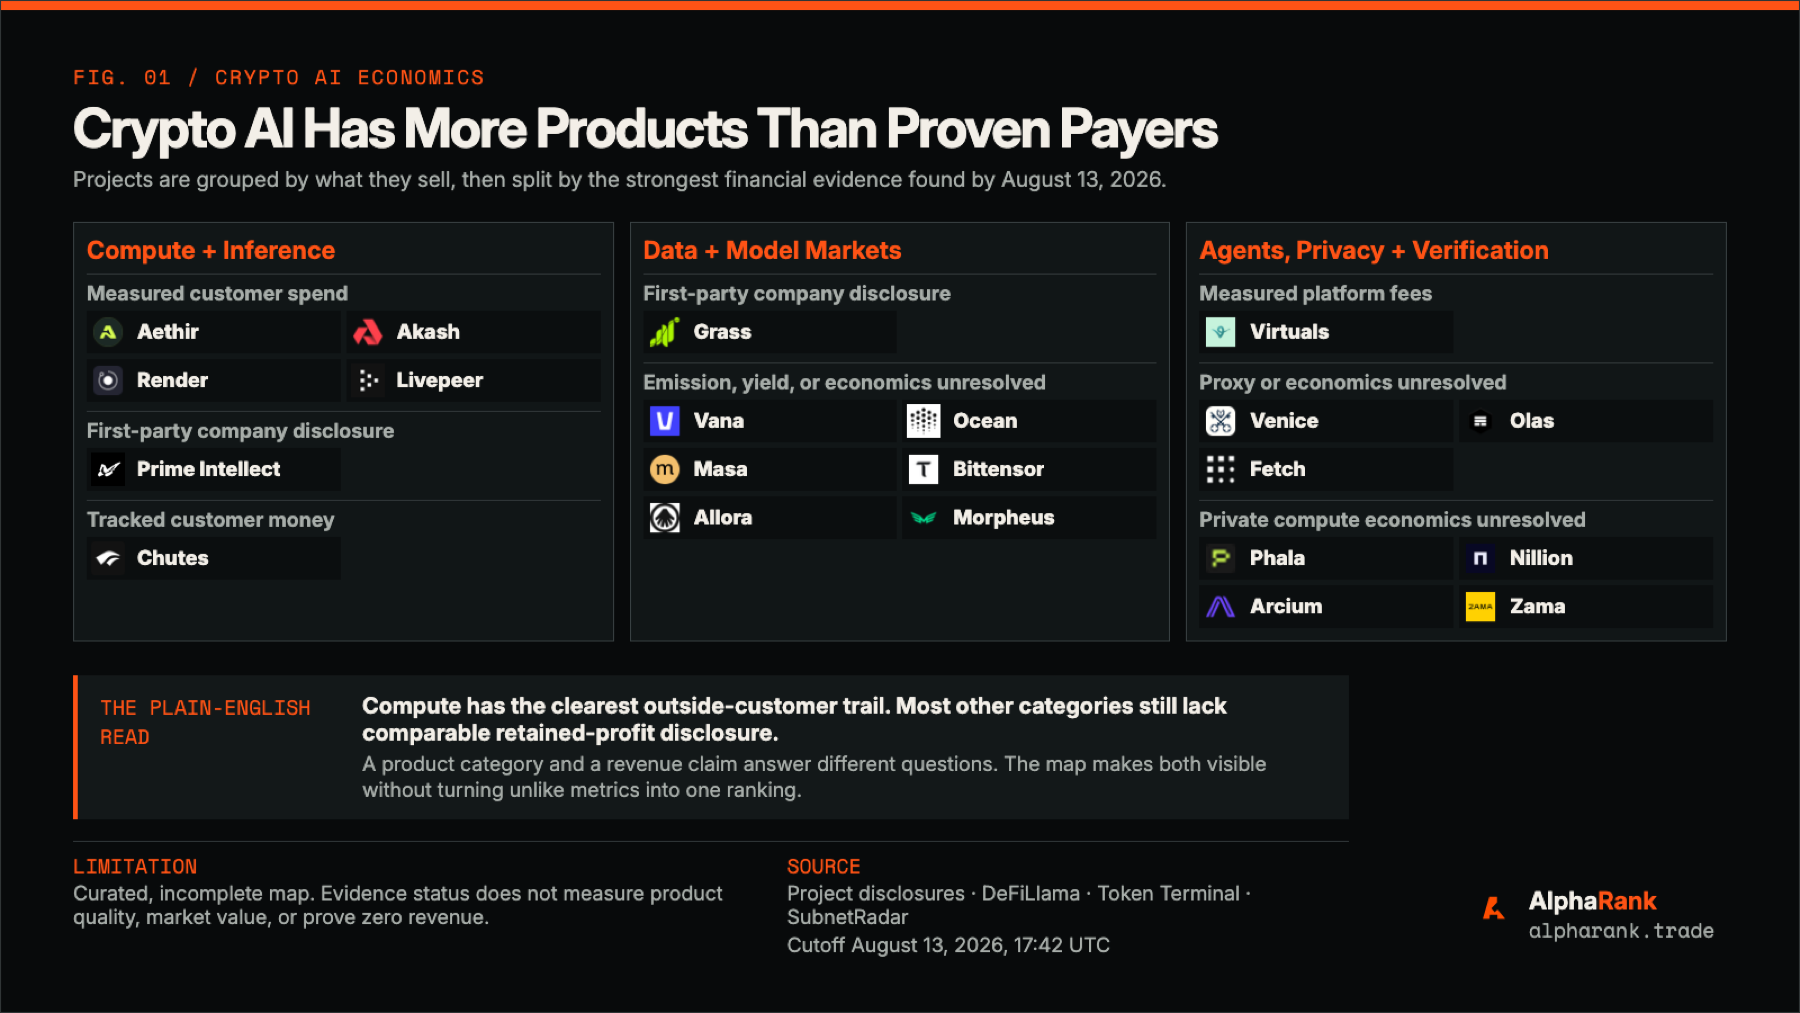
Outside demand versus inside subsidy is the useful divide. Outside demand begins with a customer who wants a result. Inside subsidy begins with a token budget designed to recruit supply or direct development. Both can build a network. Only outside demand proves that someone beyond the incentive loop values the product.
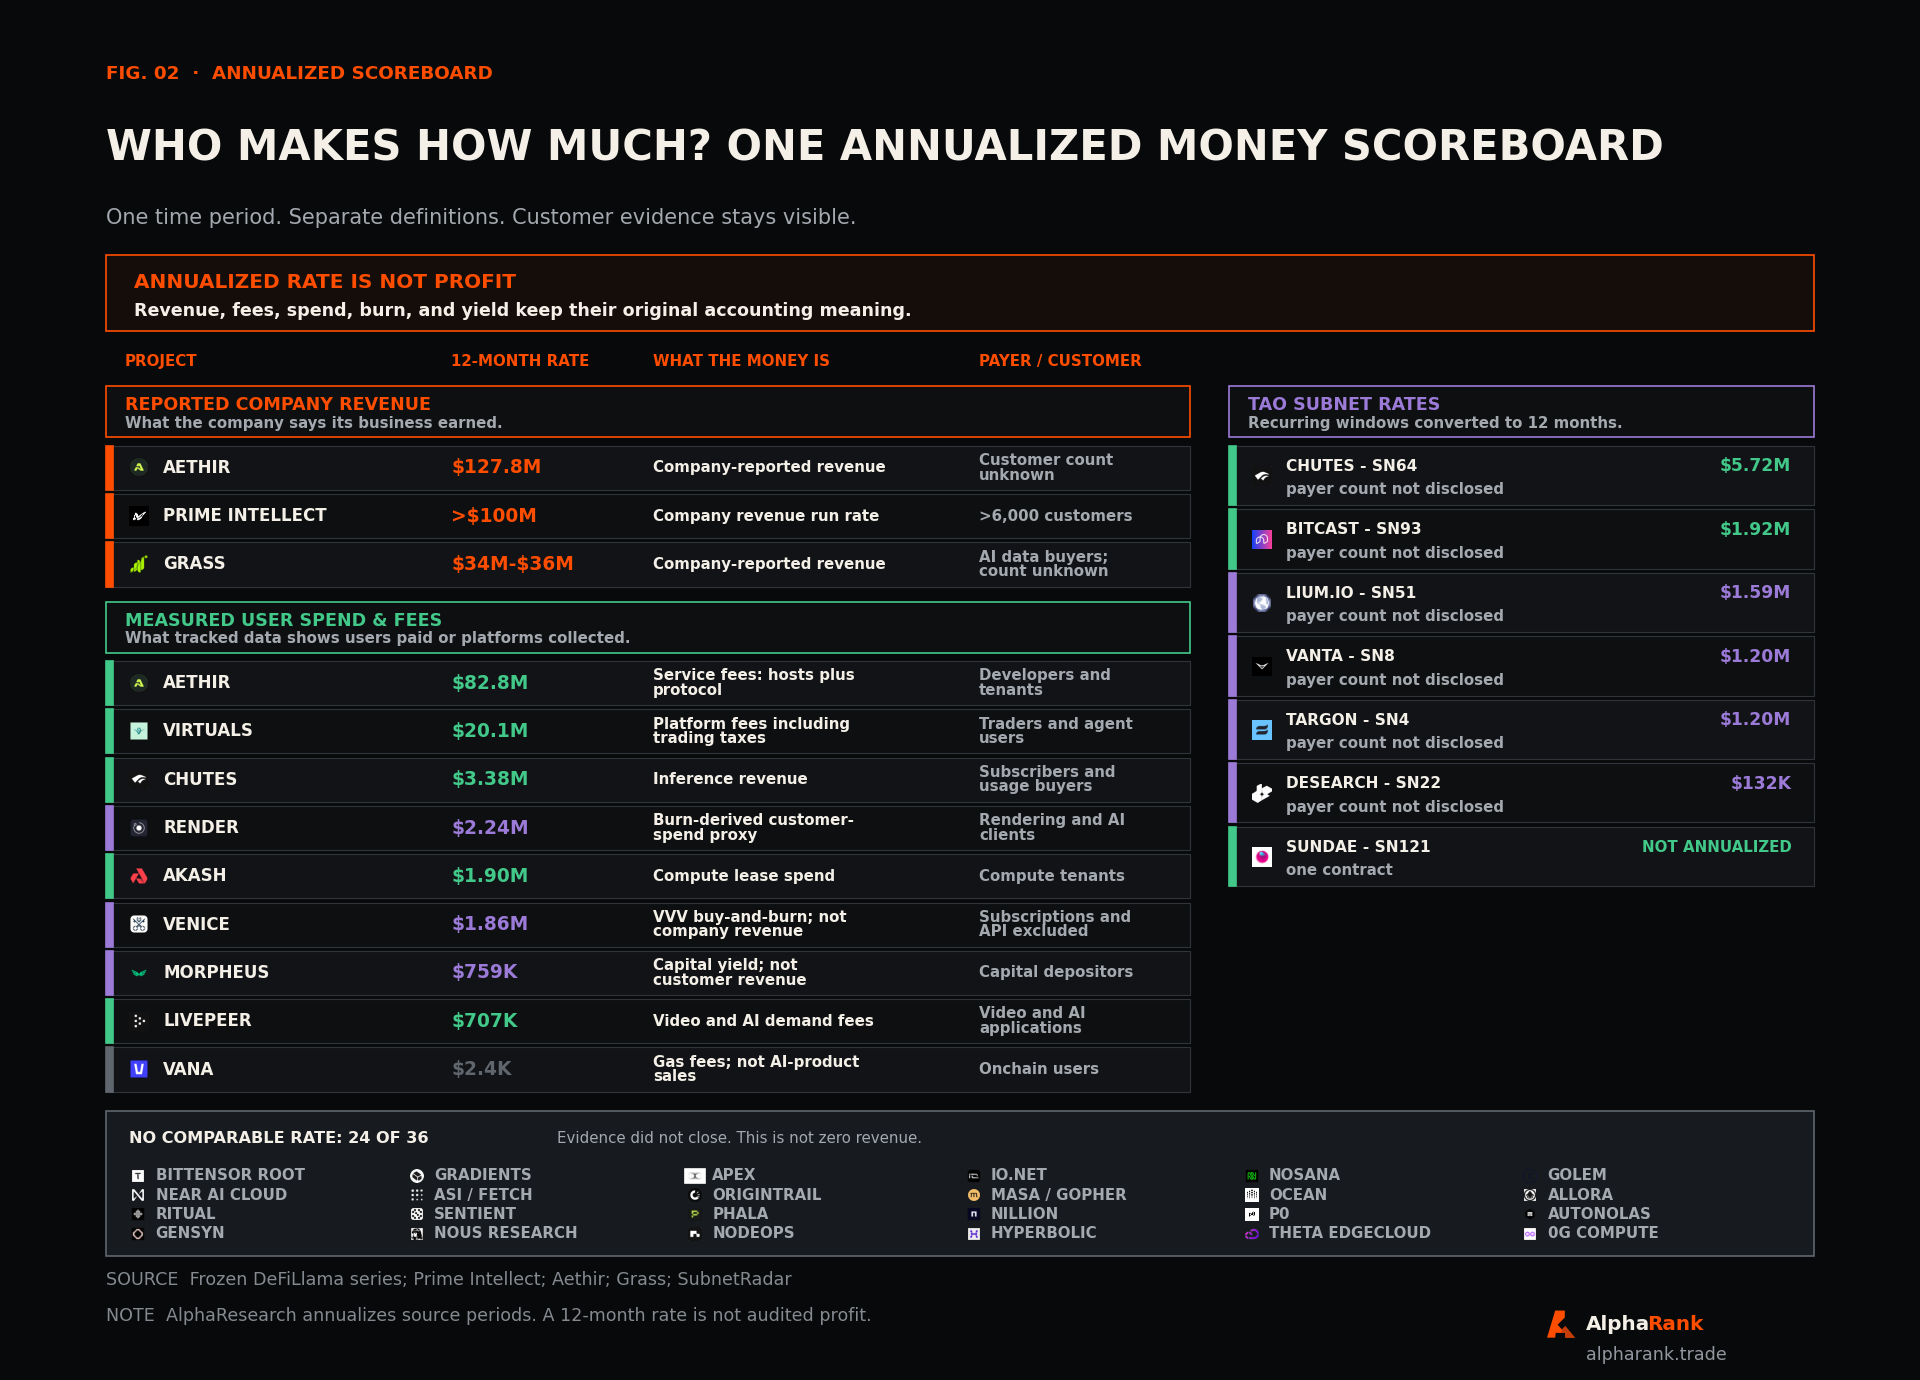
Every supported recurring money figure uses one annualized rate.
Reported company revenue is what a company says its whole business earned. Measured user spend and fees come from tracked data showing what users paid or a platform collected. Both use 12-month rates here, and neither is presented as audited profit.
Prime Intellect: the largest reported company run rate
Prime Intellect reported more than 6,000 customers and more than $100M in annualized revenue. The company spans compute, distributed training, inference, evaluation, and an open AI stack.
This is the largest current company run rate in the review. It is not an audited annual result. The disclosure does not reconcile supplier costs, incentives, operating expenses, or tokenholder value. The important follow-up is how much becomes durable protocol economics rather than company revenue that could exist without a token.
Aethir: the largest measured service-fee stream
Developers and tenants pay fiat-priced cloud-host service fees that settle in ATH. The frozen series totals $82.77M over the trailing year. Aethir's documentation routes 80% to hosts and 20% to the protocol.
Aethir separately reported $127.8M of 2025 revenue. The company disclosure may use different recognition rules and contracts, so it remains in a first-party lane rather than being forced to reconcile with the provider-defined trailing-year series.
Grass: the clearest profitability claim
Grass's financial table says $17M of H1 2026 revenue; its recap says $18M. The same page gives monthly cash expenses of $2M to $3M, calls the business profitable, and says participant rewards are paid in USDC funded from revenue rather than emissions.
The H1 top line remains unresolved at $17M to $18M. The cost and profit claims remain first-party and unaudited. Customer concentration, gross margin, renewals, and the full contributor payout ratio remain unknown.
Chutes: the strongest TAO subnet example
Chutes reports revenue categories for subscriptions, pay-as-you-go usage, invoiced users, and private instances. The frozen provider series shows $3.38M over the trailing year. SubnetRadar attributed $1.41M to Chutes in its latest 90-day tracker, about 60% of the tracker total.
That proves the customer layer is not zero. It does not prove independence from TAO emissions. Chutes can earn customer money and network rewards at the same time.
Aethir shows why gross activity, supplier income, and protocol revenue must be separated.
One service-fee event can be real while a standardized dashboard still assigns the wrong economic recipient.
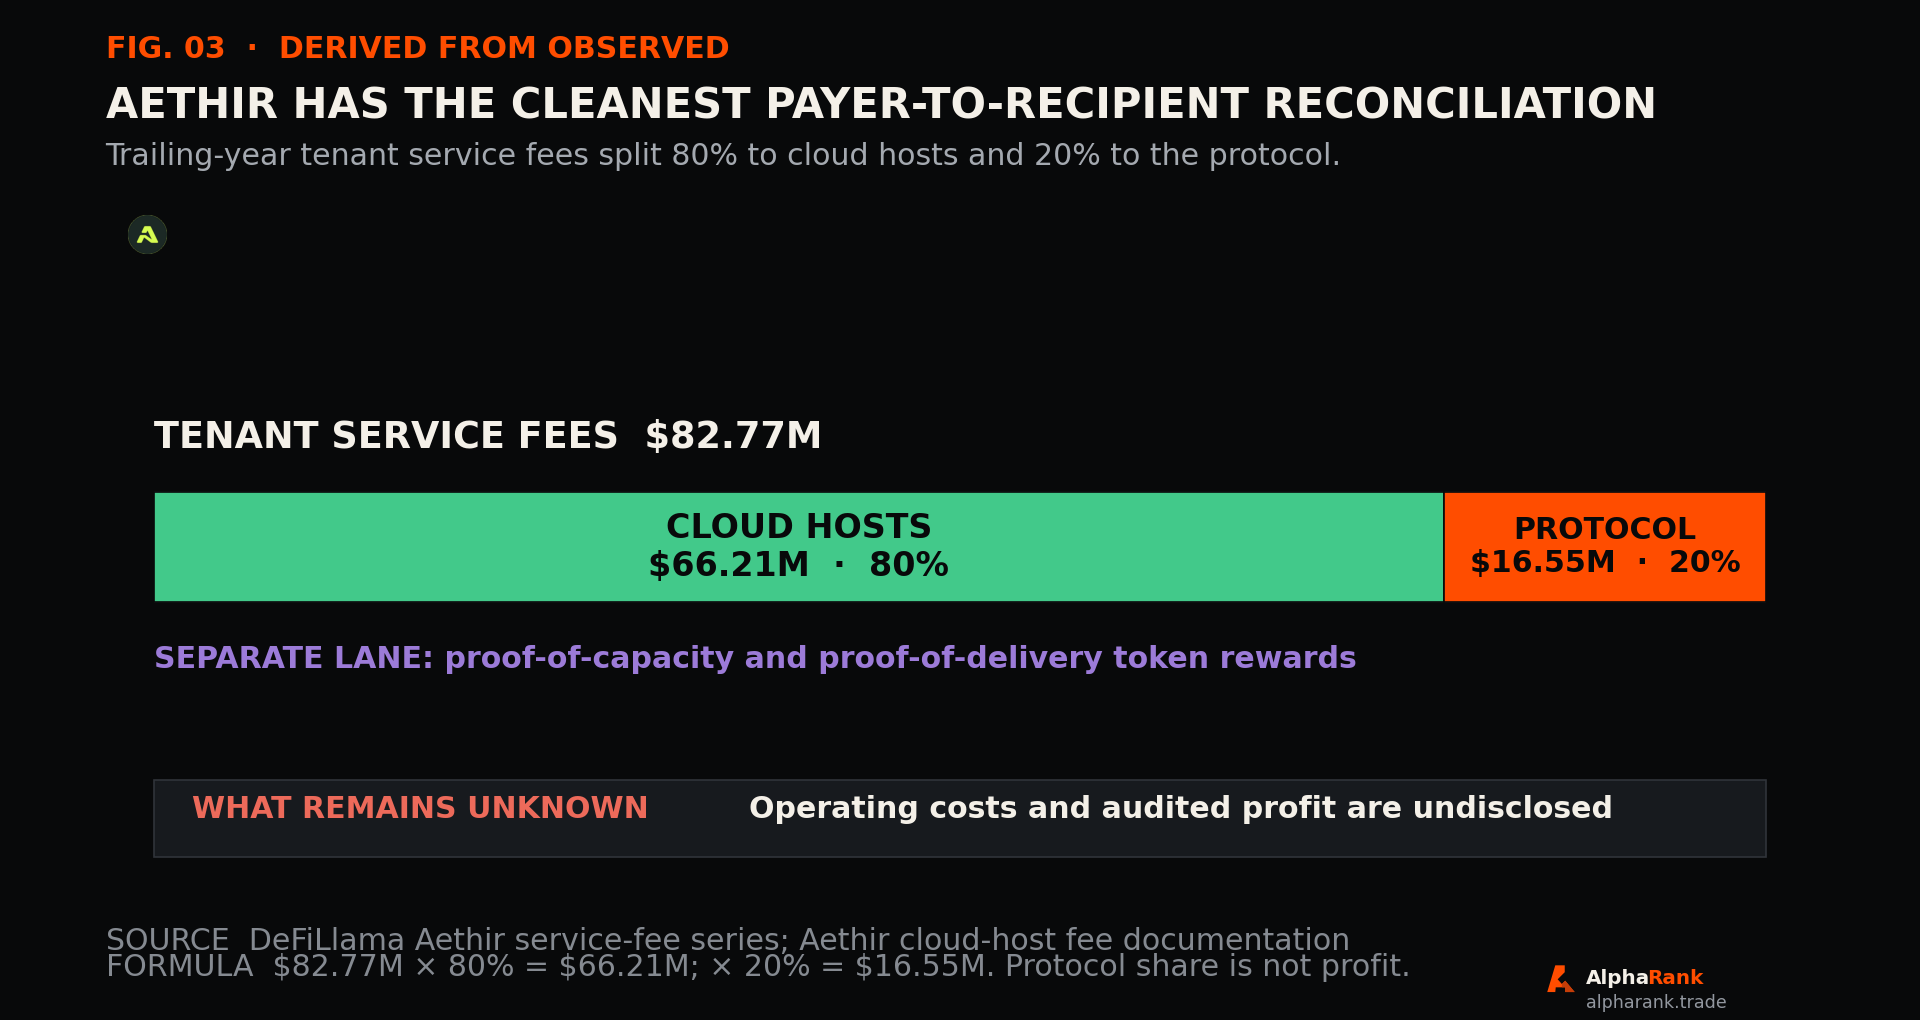
Token Terminal's visible methodology maps indexed DepositServiceFee events into both fees and revenue and shows no supply-side fee. The event volume is useful, but Aethir's contract says the host receives 80%. The report therefore treats the Token Terminal headline as gross activity, not retained protocol cash.
The split prevents three errors. The full $82.77M is not protocol revenue. The $66.21M host lane is not token emission. The $16.55M protocol lane is not accounting profit.
Aethir's series is also spiky. One daily settlement can be much larger than its neighbors. Multiplying one day by 365 would fabricate a recurring run rate that the actual series does not support.
Real customers exist, but the money reaches different constituencies.
Virtuals, Render, Akash, and Livepeer all show paid activity. None sends value through the same route.
Virtuals: $20.10M of fees, with traders inside the payer base
Virtuals charges a 1% agent-token trading tax and distributes it across different recipients, while its Agent Commerce Protocol supports paid service transactions. Often, the payer is a trader buying or selling an agent token rather than a business purchasing useful AI work.
Virtuals now needs to disclose how much comes from completed agent jobs and returning customers versus financial activity around agent identities.
Render: $2.24M of burn-derived customer spend
Render's implemented BME deducts a 5% transaction fee and burns the balance of customer payments. Node operators receive separately minted rewards. The $2.13M trailing-year burn series therefore implies about $2.24M of gross spend under that rule.
The customer-to-token route is clear. The net tokenholder result is not. Burn must be compared with newly minted node rewards and other supply changes.
Akash: $1.90M of trailing-year lease spend routed to providers
Customers buy compute from providers. The frozen provider series reports $1.90M as supply-side revenue and zero retained protocol revenue. Akash completed AEP-76 in March 2026: customers fund ACT by burning or market-buying AKT, providers settle in AKT, and the old AEP-23 take rate is removed. The primary economic recipient remains the provider.
Livepeer: $706,961 of trailing-year demand fees
Livepeer's Q1 report separated $154,700 of AI fees from $257,300 of total demand fees. Applications pay orchestrators for video and inference work. LPT inflation is a separate security and coordination budget.
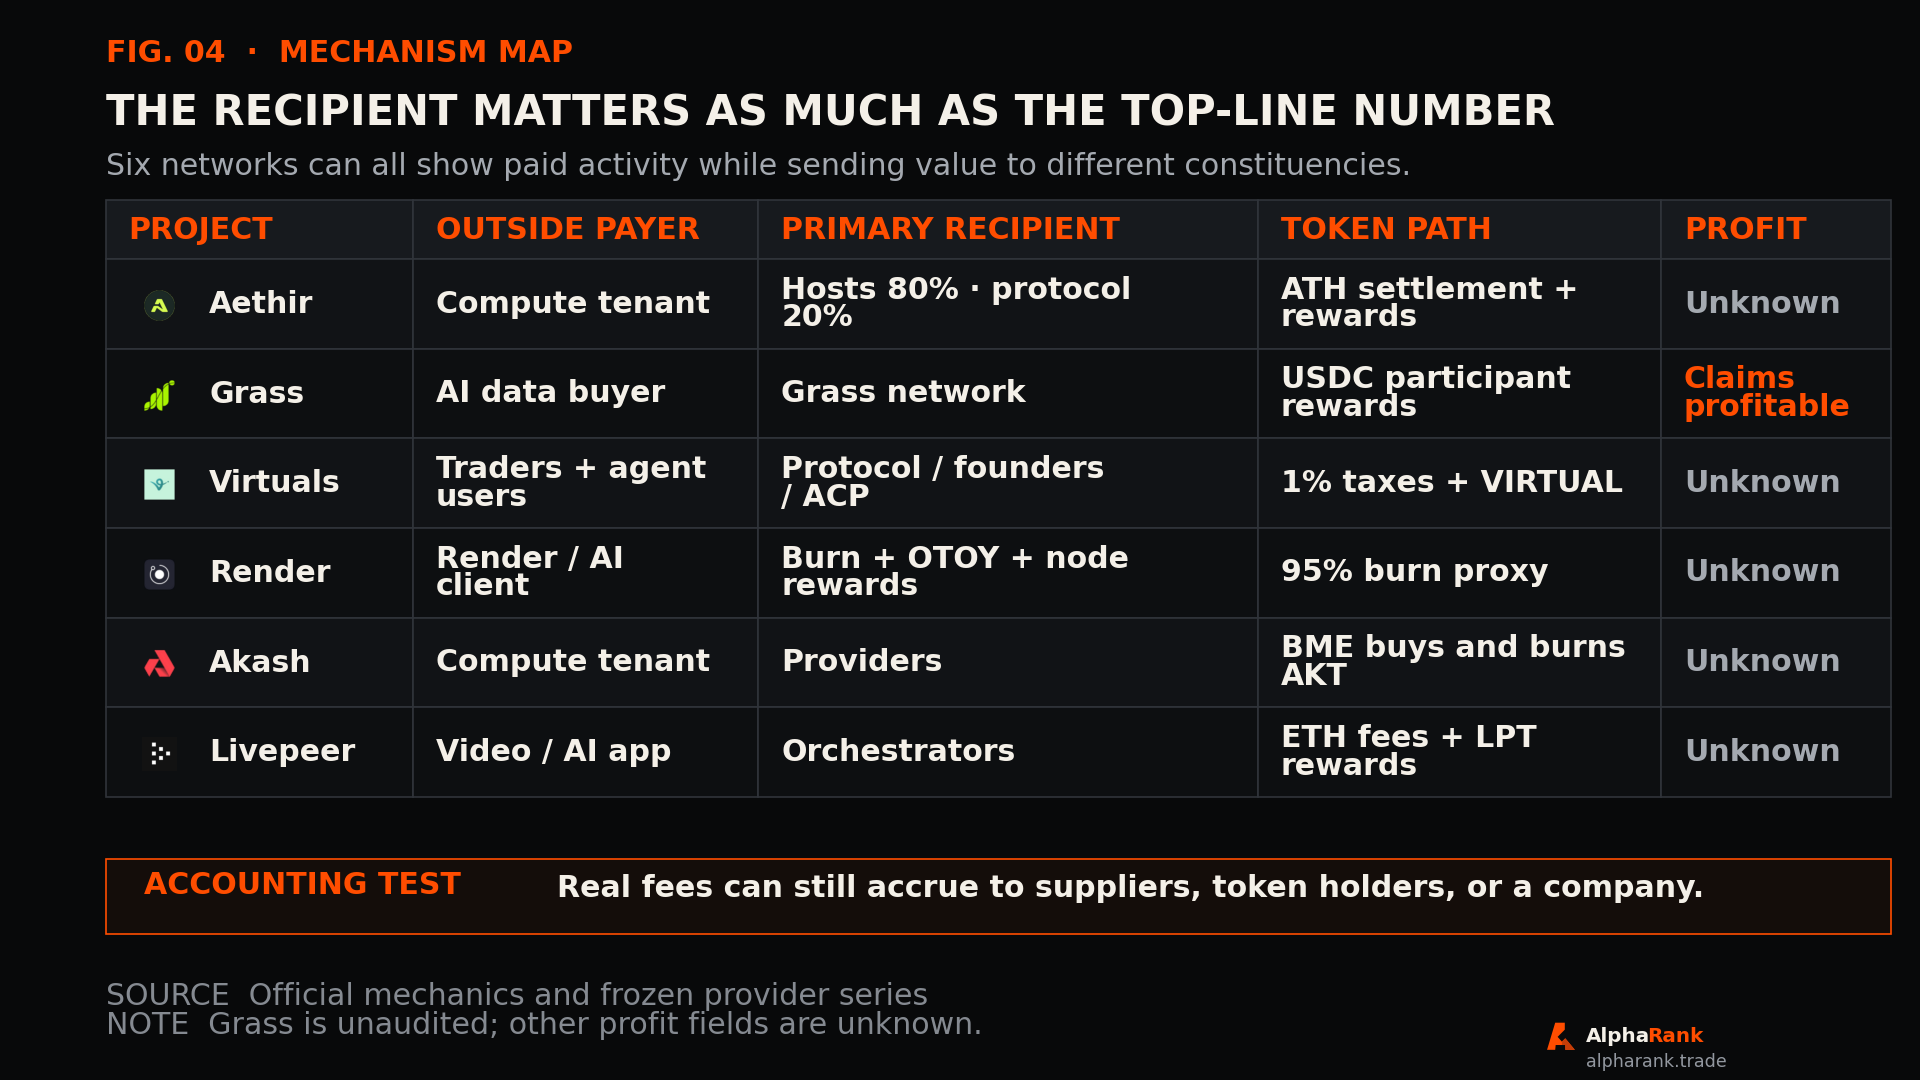
A real customer layer sits under a much larger subsidy layer.
Bittensor is a market allocator before it is an income statement. Its emissions show where the network directs its budget, not whether an outside customer bought the service.
The network issued 0.5 TAO per block, about 3,600 TAO per day, at the cutoff; the per-tempo split sends 18% to the owner, 41% to miners, and 41% to validators and stakers. Those are emission routes.
SubnetRadar's latest tracker listed seven revenue entries totaling $2.34M. Chutes supplied $1.41M. Several other entries were self-reported, used nonstandard periods, or represented one contract.
| Subnet | Netuid | Product | Published revenue | Evidence |
|---|---|---|---|---|
| Chutes | 64 | Serverless inference | $1.41M · latest tracked 90d | TI verified |
| Lium.io | 51 | GPU marketplace / inference | $530K · Jan-Apr 2026 | Self-reported |
| Bitcast | 93 | AI media and content | $160K · Apr 2026 | TI verified |
| Vanta | 8 | Trading intelligence | $100K MRR · Mar 2026 | Self-reported |
| Targon | 4 | Confidential GPU compute | $100K · Apr 2026 | Self-reported |
| sundae_bar | 121 | Commercial AI service | $32K · Mar 2026 contract | TI verified |
| Desearch | 22 | Decentralized search | $11K MRR · Oct 2025 | Self-reported |
At the frozen TAO spot price of $200.10, 90 days of base issuance had a spot value of $64.83M. Divided by the $2.34M tracked total, the ratio is 27.7 times. Outside revenue needs to grow faster than emissions, repeat across more subnets, and survive falling rewards.
The market rewarded different stories from the operating ledger.
Price performance provides investor context. It does not prove revenue, profit, product quality, or token capture.
In the frozen CoinGecko market_chart series, VVV led the latest 30 days at +14.4%, followed by VIRTUAL at +4.8% and TAO at +1.3%. Grass was the only positive asset over 90 days at +3.3%. ATH, the token attached to the largest measured fee stream, fell 36.5% over the same 90-day window.
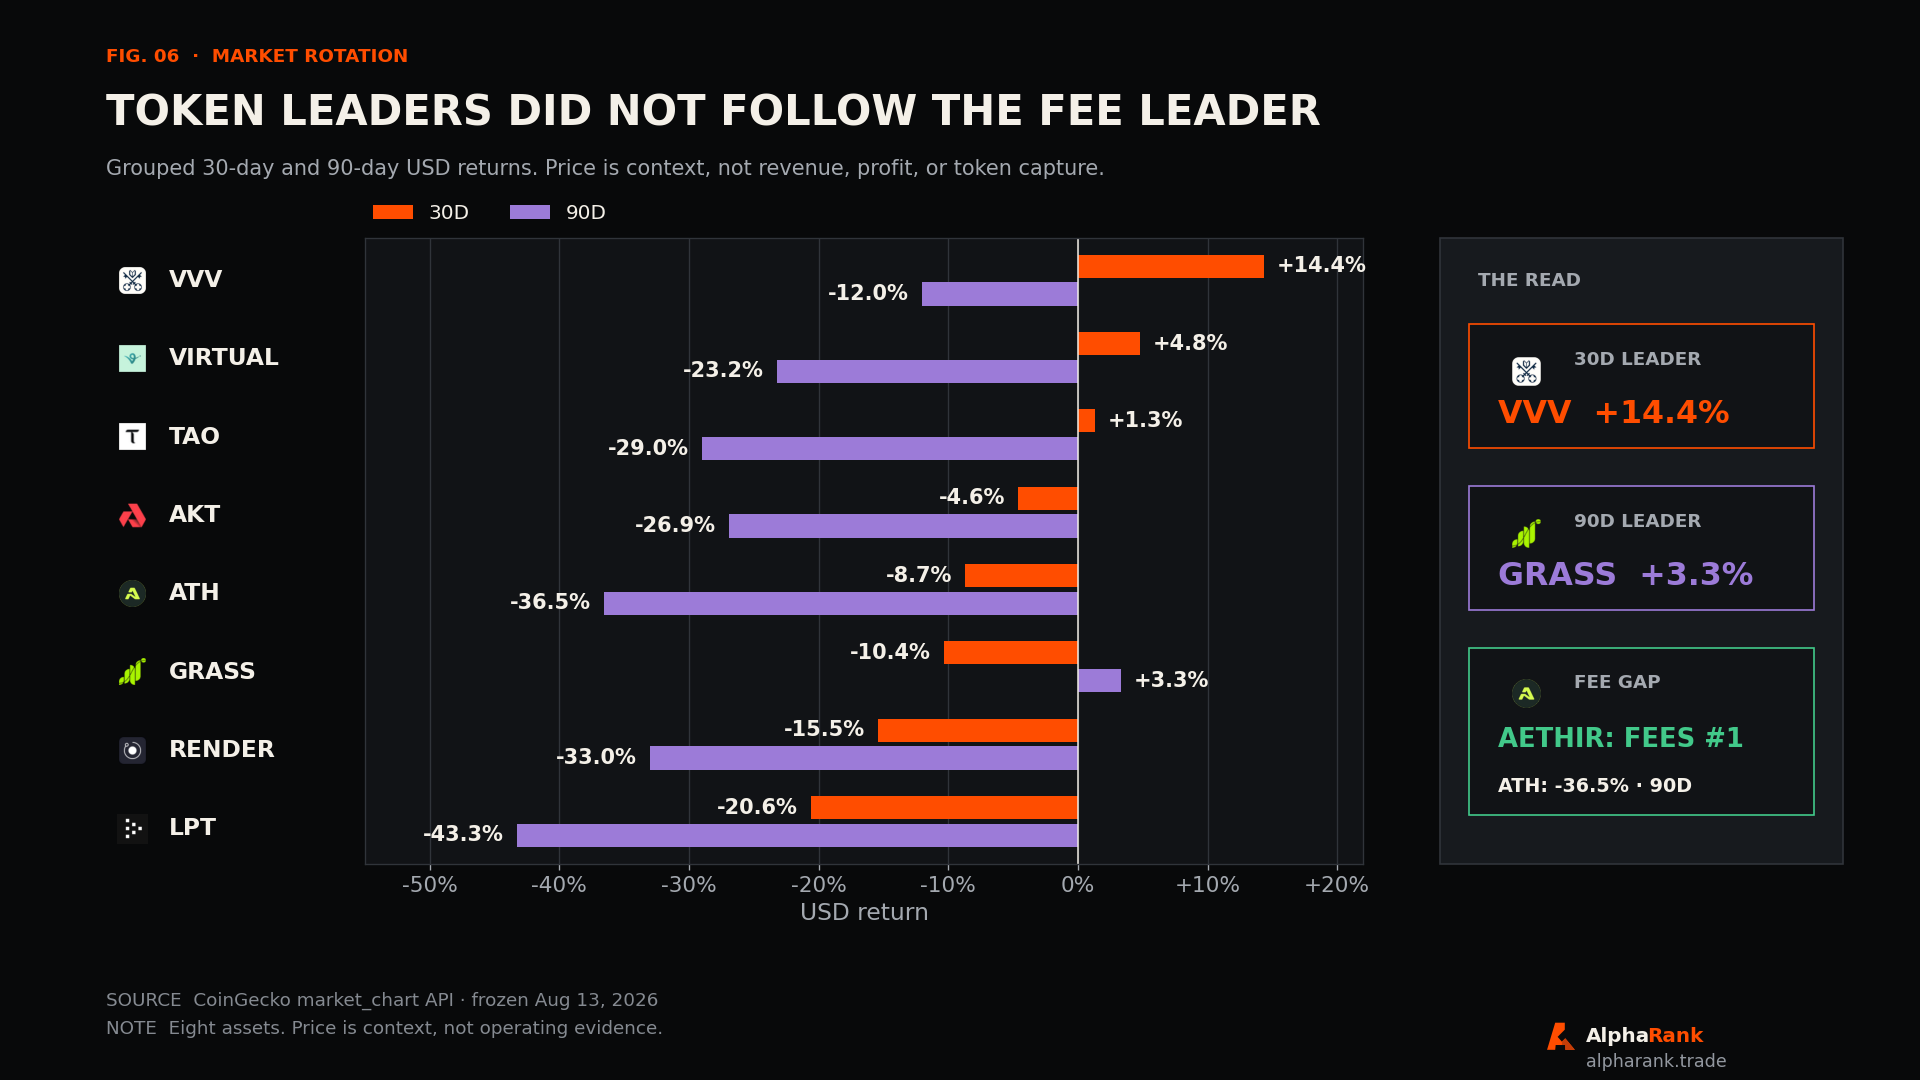
market_chart series for VVV, VIRTUAL, TAO, AKT, ATH, GRASS, RENDER, and LPT.VVV was the short-window price leader, while its complete subscription and API revenue remains undisclosed. VIRTUAL and TAO offered adjacent beta to the agent and subnet narratives. Grass supplied the cleaner 90-day relative strength and the only profit claim, but its official H1 revenue contradiction and 45.8% drawdown from the 90-day peak keep that claim from becoming a clean fundamental ranking.
Product success can bypass the token.
A strong token route starts with outside cash, pays the suppliers needed to deliver the service, leaves a repeatable surplus, and connects that surplus to the asset through a rule that users cannot cheaply bypass.
Aethir tenants can pay for compute while hosts receive most of the fee. Grass can sell data and reward contributors in USDC. Virtuals can collect taxes that reach several constituencies. Render can burn tokens while minting node rewards. Akash can pay providers through ACT and AKT settlement. Livepeer can pay orchestrators in ETH while issuing LPT for security.
Several visible flows stay outside the revenue ranking. The $1.86M Venice series measures VVV buy-and-burn, while Venice's own mechanism ties only fixed amounts or a portion of revenue to burns. The $758,536 Morpheus flow is capital yield. The $2,363 Vana series is gas. None measures a complete AI income statement.
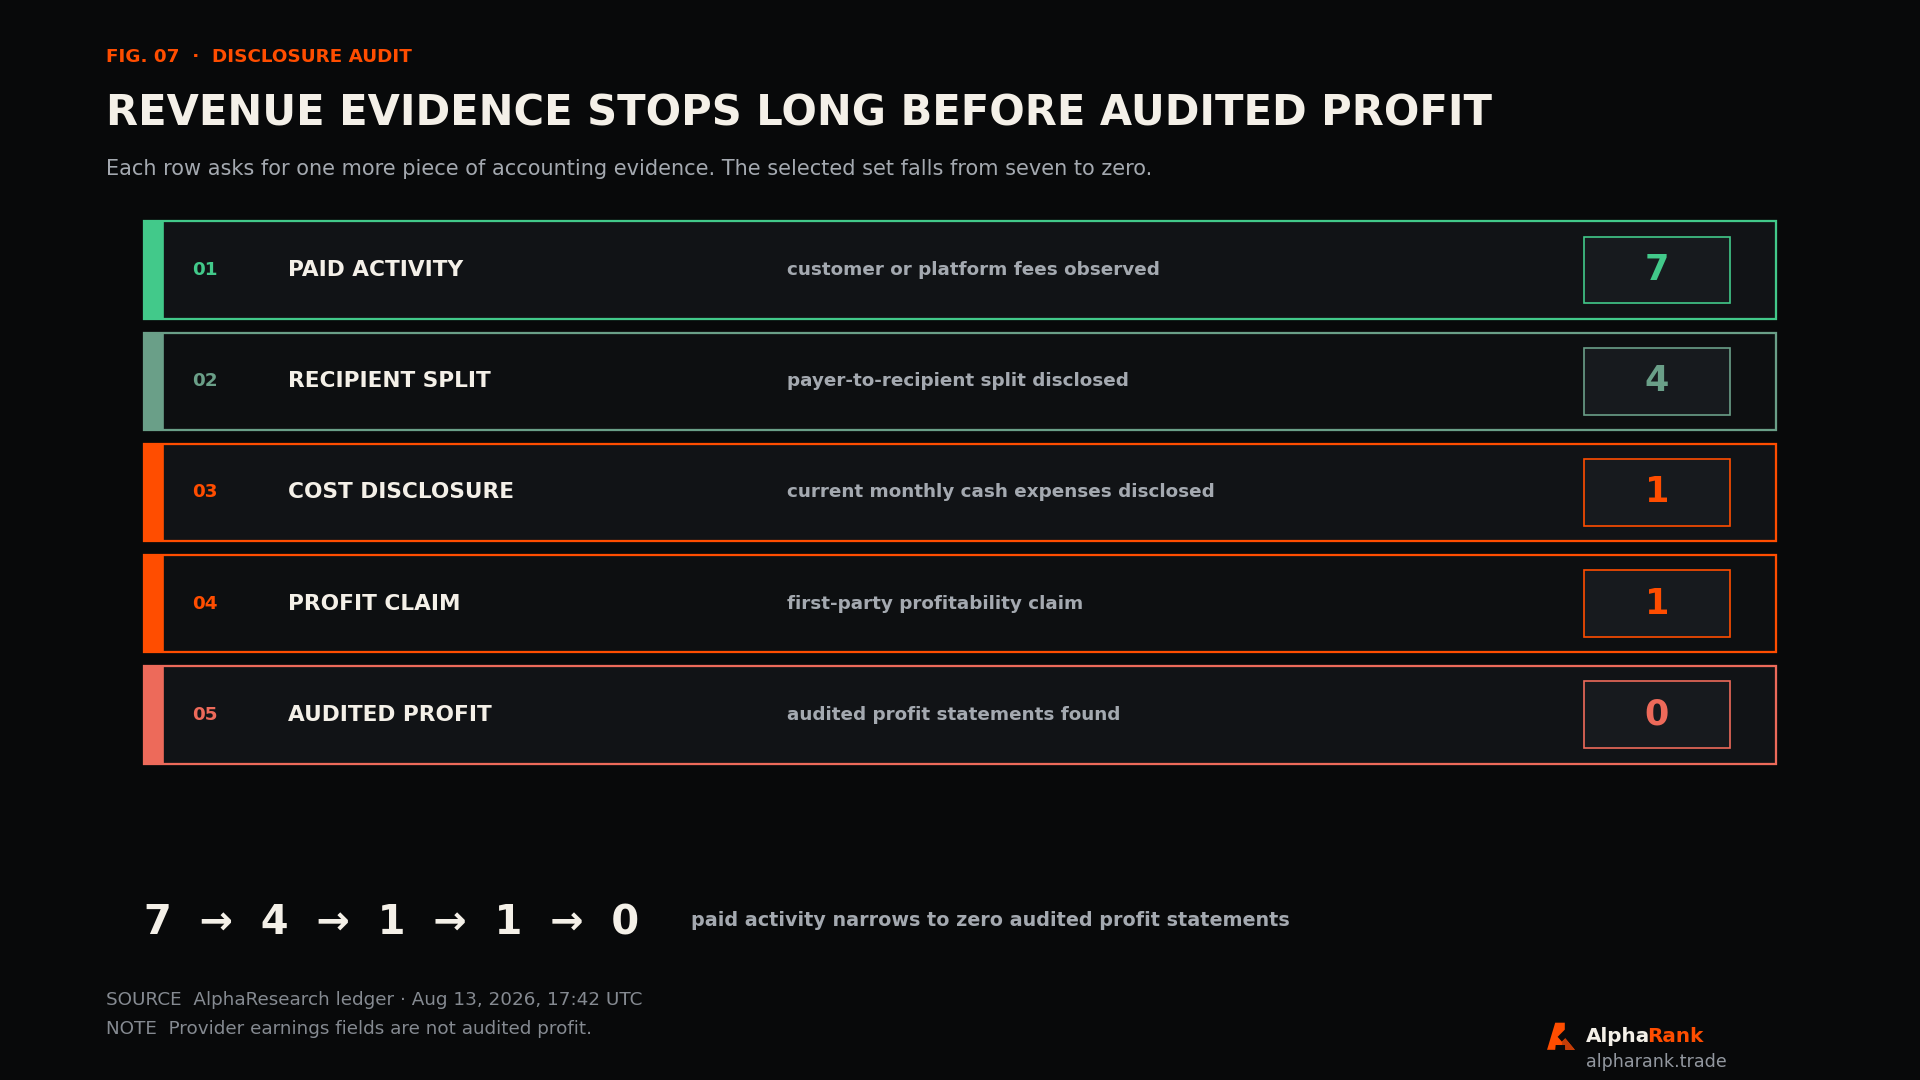
The largest numbers carry the largest definition risk.
Annualized rates, prepayments, credits, and gross supplier pass-through can inflate a headline without increasing retained cash.
Free tiers, sponsored inference, grants, and emissions can create usage that disappears when the budget falls.
Most projects do not disclose their largest customers, renewal rates, related parties, or contract terms.
A product can grow while providers or a private company keep the value and the liquid token remains optional.
Burns and buybacks can be smaller than emissions, unlocks, treasury sales, or rewards over the same period.
TAO subnet names, netuids, products, and emission shares change. A current dashboard is not a historical cutoff record.
These risks are active in the evidence. Grass publishes two H1 revenue values. Chutes disclosed free and underpriced usage that it later removed. Bittensor's allocation formula and live subnet shares can change. The report keeps those uncertainties inside the conclusion.
Suppliers have the clearest cash lane. Protocol profit remains mostly unknown.
Companies. Prime Intellect reports the largest run rate. Grass reports H1 revenue and profitability, with a $17M to $18M contradiction. Aethir reports $127.8M of 2025 company revenue. All remain unaudited in this review.
Compute and network suppliers. The Aethir host rule implies $66.21M over the trailing year. Akash providers and Livepeer orchestrators receive most or all observed customer fees. TAO participants receive an emission budget far larger than the tracked outside-revenue pool.
Protocols and treasuries. Aethir's documented split implies $16.55M of trailing-year protocol share. Other projects often do not publish a complete retained-cash reconciliation.
Token holders. Render supplies the clearest customer-linked burn rule. Venice supplies a revenue-linked buy-and-burn rule. Net tokenholder effect still depends on issuance, unlocks, and other supply changes.
Accounting owners. Grass says it is profitable. No liquid network in the selected set supplied an audited statement that reconciled revenue, supplier costs, incentives, operating expenses, and net income.
Crypto AI has proven customer demand. Audited profit and durable token capture remain rare.
The ranking moves only when the evidence crosses a measurable threshold.
| Signal | Trigger | Cadence | Source |
|---|---|---|---|
| Aethir retention | One statement reconciles gross fees, host payouts, incentives, costs, and profit; or trailing-year gross fees fall 20% from this freeze | Monthly | Fee series + official rule |
| Grass profit | Audited accounts resolve $17M vs $18M and show positive operating income after contributor payouts | Quarterly | Financial updates |
| Virtuals service mix | ACP customer spend exceeds agent-token trading taxes for three consecutive months | Monthly | ACP + tax rules |
| TAO customer layer | Tracked outside revenue reaches at least 10% of same-window spot-valued base issuance and at least 15 subnets disclose paying customers | Monthly | Revenue tracker + emissions |
| Chutes quality | Paid, nonsponsored revenue and compute cost reconcile for a completed quarter with positive gross margin | Quarterly | Revenue categories + company updates |
| Token capture | Render or Venice burns exceed same-period net issuance for three consecutive months | Monthly | Render BME + Venice burns |
| Market rotation | ATH or LPT enters the top three 90-day returns while its paid-demand series also grows | Weekly | CoinGecko market-chart endpoint + named fee series |
Five monthly fields would remove most of the remaining ambiguity: outside cash, supplier cost, token issuance, retained cash after operating costs, and same-period burns, buybacks, unlocks, and mints. Customer concentration and renewal rates complete the picture.
Sources & methodologyPrimary project records and frozen market-data series · cutoff August 13, 17:42 UTC
Every promoted claim links to publishable evidence. Internal discovery material was used only to locate leads, conflicts, and missing questions. Private source identities and raw text remain outside the public report.
- DeFiLlama fee methodologyMETHODOLOGY
- Aethir fee seriesFROZEN PROVIDER SERIES
- Token Terminal · Aethir statementMARKET DATA
- Aethir service-fee splitPRIMARY
- Aethir 2025 company disclosurePRIMARY · FIRST-PARTY
- Prime Intellect Series A disclosurePRIMARY
- Grass financial updatePRIMARY
- Virtuals fee seriesFROZEN PROVIDER SERIES
- Virtuals trading-tax allocationPRIMARY
- Virtuals Agent Commerce ProtocolPRIMARY
- Chutes revenue categoriesPRIMARY
- Chutes subsidy and efficiency updatePRIMARY
- Chutes fee seriesFROZEN PROVIDER SERIES
- Render RNP-006 BMEPRIMARY GOVERNANCE
- Render BME burn seriesFROZEN PROVIDER SERIES
- Akash fee seriesFROZEN PROVIDER SERIES
- Akash AEP-76 BMEPRIMARY · FINAL
- Livepeer Q1 2026 demand feesPRIMARY SUMMARY
- Bittensor emissionsPRIMARY
- SubnetRadar revenue trackerSPECIALIST DATA
- TAO cutoff spot observationFROZEN MARKET DATA
- Venice holder-revenue seriesFROZEN PROVIDER SERIES
- Venice buy-and-burn mechanicsPRIMARY
- MorpheusAI yield seriesFROZEN PROVIDER SERIES
- Vana gas-fee seriesFROZEN PROVIDER SERIES
- Eight exact market-chart seriesASSET IDS FROZEN IN PACKAGE
Periods. Comparable provider figures use the trailing year ending August 12. Company run rates and half-year disclosures stay in separate lanes.
TAO proxy. Ninety days of base issuance is valued at one cutoff spot price. It is not historical USD issuance.
Profit. Provider “earnings” fields that subtract token incentives do not establish full accounting profit.
Map. The ecosystem map is intentionally incomplete. Gray means comparable financial evidence was not found, not that revenue is zero.
Market context. Thirty-day and 90-day returns use nearest daily observations in the frozen CoinGecko series. They are not operating evidence.
Privacy. Internal evidence IDs, source mappings, context, timestamps, and raw text remain in the private research ledger.